
3D FRACTURE MODEL
Drs Liwei Guo, Jiansheng Xiang, John-Paul Latham
and Mr Ado Farsi and Dr Andy Pullen (validation research)
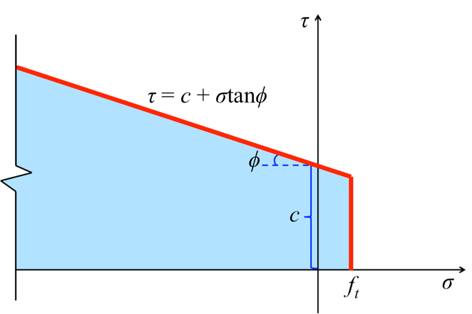
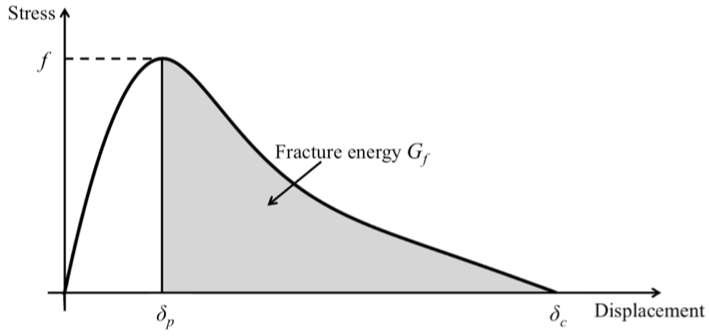
The constitutive model used in the three-dimensional fracture model is similar to the combined single and smeared crack model proposed by Munjiza et al. (1999). The normal stress σ and the shear stress τ, corresponding to the normal displacement δn and the shear displacement δs between triangular surfaces, respectively, are calculated according to a constitutive law as shown above. The peak stress f on this stress-displacement curve represents the material strength, so for normal stress σ, it means tensile strength ft; and for shear stress τ, it means shear strength fs. The tensile strength ft is assumed to be a constant, while the shear strength fs is defined by the Mohr-Coulomb criterion with a tension cut-off where c is cohesion, ϕ is internal friction angle, σn is the normal stress acting perpendicular to the shear direction. Note here the engineering mechanics sign convention is used, so tensile stress is positive and compressive stress is negative. In the figure below, fracture energy Gf is a material property, which defines the energy needed for fracture surface to propagate per unit area. δp is the maximum elastic displacement corresponding to peak stress f between two triangular surfaces in a joint element, and δc is the critical displacement, at which the joint element fails.
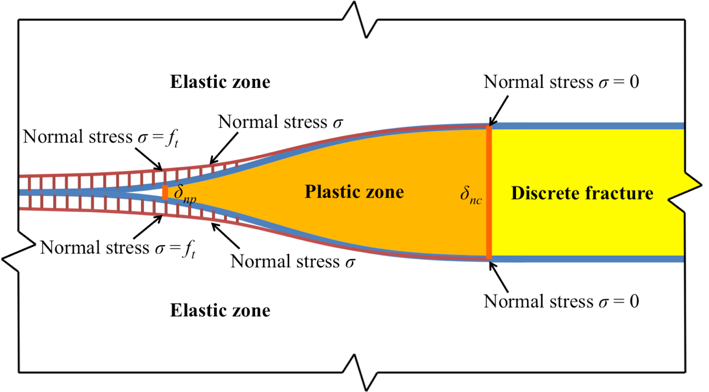
For a single mode I tensile fracture, for example, the physical meanings of δp and δc is illustrated below. For this case, because it is pure tension, δp is represented by δnp and δc is represented by δnc. In the below figure, the white area represents the continuum domain that is intact without any fractures; the light yellow area represents physically discrete fracture; the orange area between them is defined as plastic zone, which corresponds to the strain softening part (δnp ~ δnc) in the above figure. It is worth noting that in the figure below, which represents the crack propagating from right to left, the short vertical red bars between the red line and the blue line represent the magnitudes of normal stress σ in the joint elements. It can be seen that δnp represents the position, where the normal stress σ in the joint element reaches its peak value (tensile strength ft); ahead of this position (to the discrete fracture direction), the domain is at a strain softening stage (orange area), which means the normal stress σ decreases from tensile strength ft to zero while the normal displacements δn increases from δnp to δnc. After this moment (when δn = δnc), this joint element will fail and the constitutive law is not applied to this failed joint element anymore. Instead, the interaction between the fracture walls will be counted as contact force, including normal compression and sliding friction, which is calculated by the contact algorithms. The detailed contact algorithms for the three-dimensional FEMDEM method can be found in Munjiza’s book (2004). Furthermore, empirical microscale roughness effects can also be introduced via a Joint Constitutive Model, to account for dilation and normal stiffness on stressed new and pre-existing fracture surfaces, for implementation of empirical JCM, see Lei et al. (in review, 2016).
Illustrative Examples:
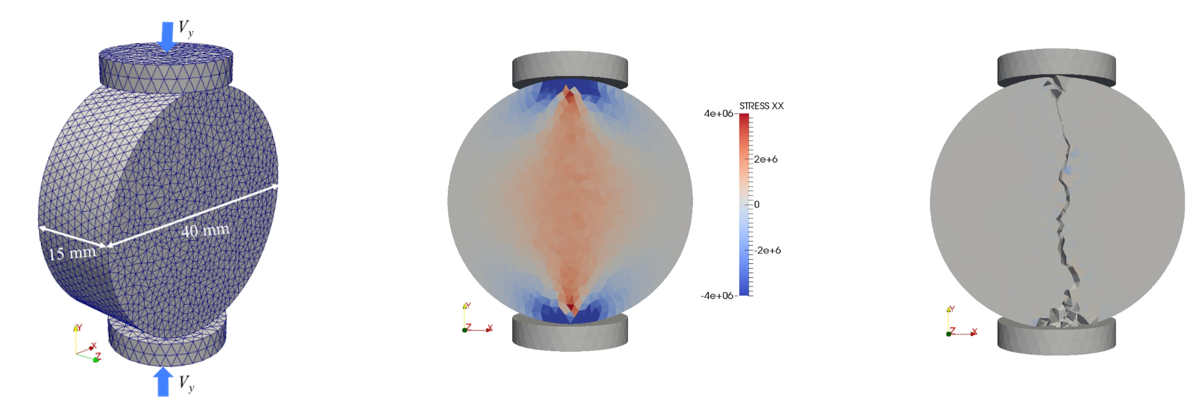
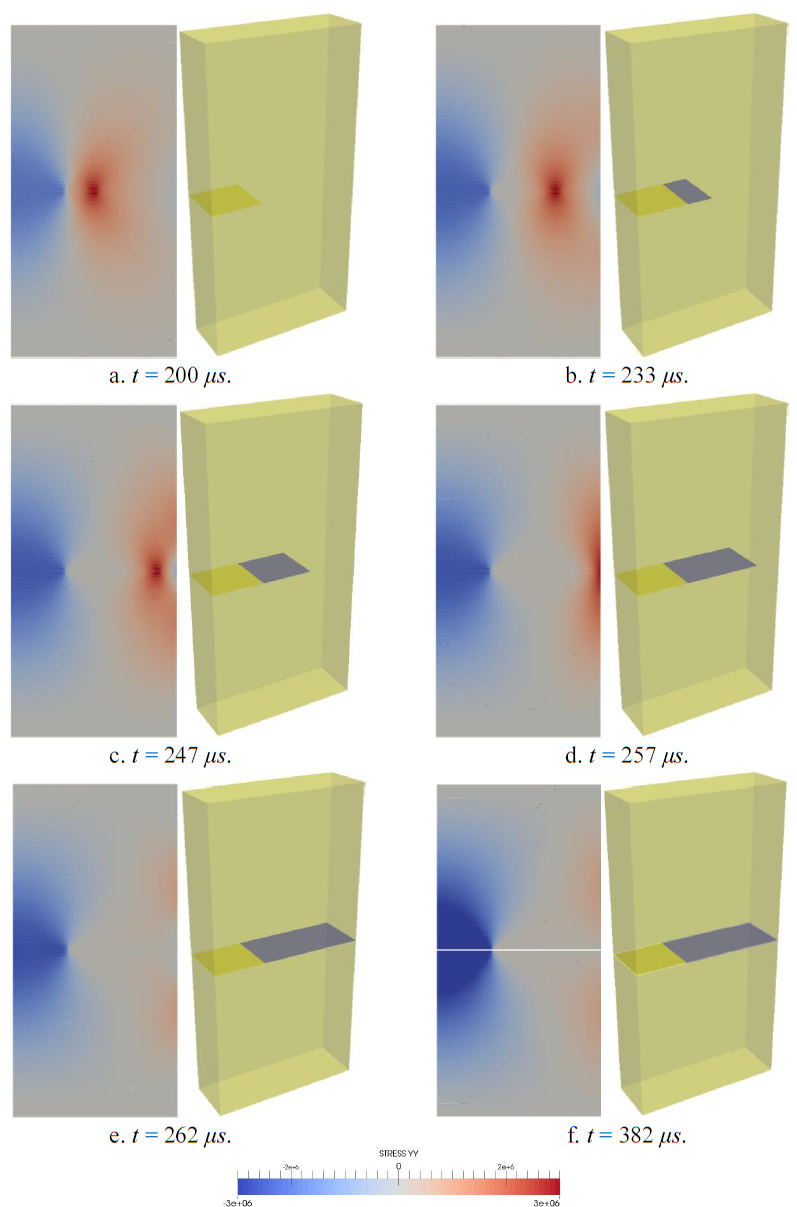
Liwei Guo implemented a 3D FEMDEM fracture model in Solidity (PhD Thesis, Imperial College London, 2014). Results for the Brazilian disc test below show the build up of the tensile stress in the horizontal direction centrally while they remain compressive adjacent to the platens, the final fracture showing mode I tensile crack behaviour centrally with shear cracking near the loading platens.
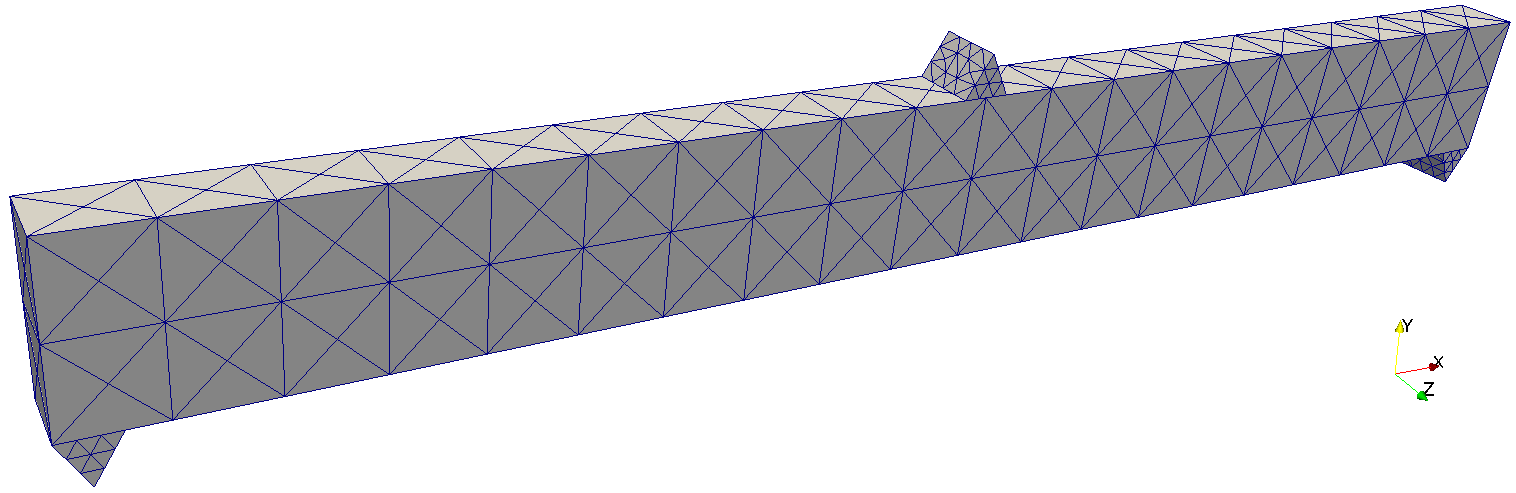
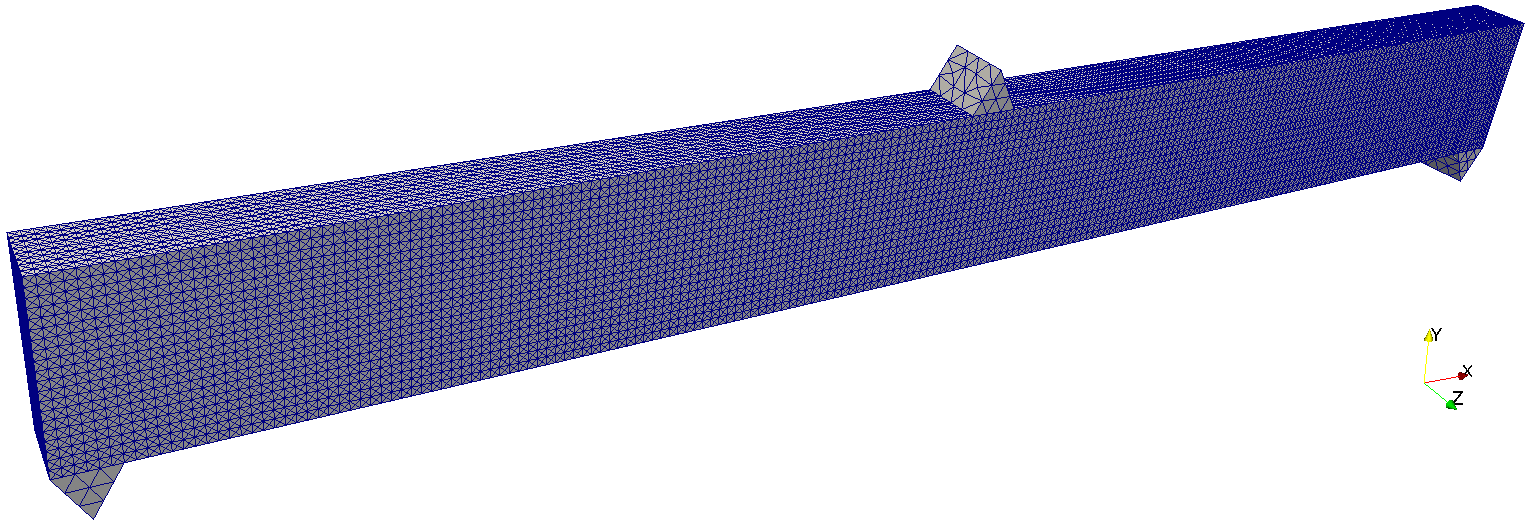
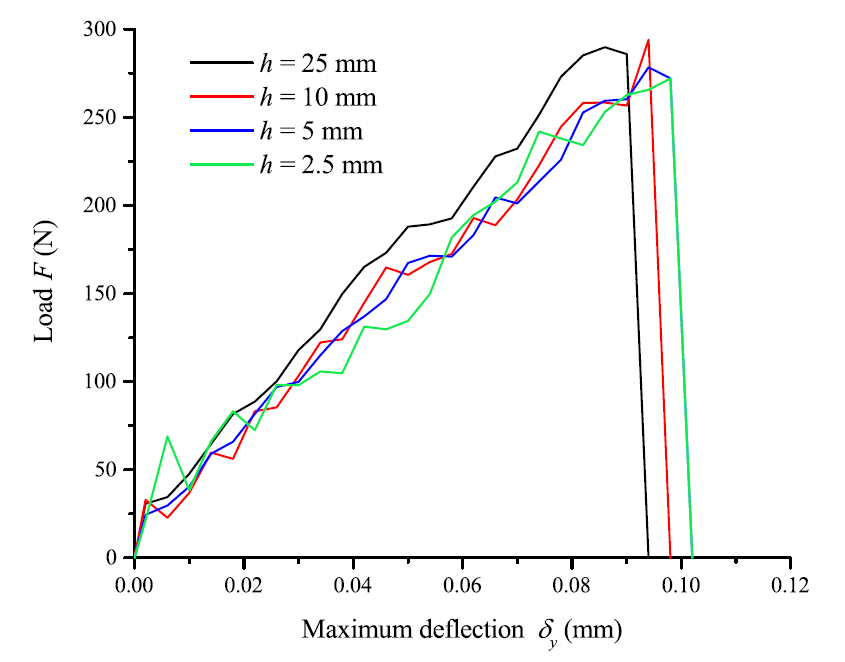
A detailed study of mesh size sensitivity by Guo et al 2015 illustrated mode I fracture development from tensile loading with an initial thin notch in a specimen of 120 x 60 x 20 mm. It can be seen that longer plastic zones are generated from larger element sizes and the plastic zone length converges to 15 mm for element size equal to or smaller than 5 mm. Compared with the theoretical estimations , it can be deduced that the plastic zone should be discretised by at least three finite elements to give a correct numerical representation of the plastic zone ahead of the fracture tip. A three-point bending test with a beam of 500 mm length was examined with various element mesh resolutions and in the finest case, ~ 0.78m tetrahedral mesh elements and convergence was noted for mesh sizes of 2.5 and 5 mm.
Validation
The following movies summarise part of the FEMDEM fracture model validation campaign in the PhD research of Ado Farsi.
References
Guo, L., Latham, J. -P., & Xiang, J. Numerical simulation of breakages of concrete armour units using a three-dimensional fracture model in the context of the combined finite-discrete element method. Computers and Structures, 146, (2014). 117-142. doi:10.1016/j.compstruc.2014.09.001
Guo L, Xiang J, Latham J-P, 2016, A numerical investigation of mesh sensitivity for a new three-dimensional fracture model within the combined finite-discrete element method, Engineering Fracture Mechanics, Vol: 151, Pages: 70- 91
http://dx.doi.org/10.1016/j.engfracmech.2015.11.006
Farsi, A., Xiang, J., Latham, J.P., Pullen, A., Carlsson, M., Stitt, E. H., & Marigo, M. (2015). IV International Conference on Particle-based Methods – Fundamentals and Applications; In IV International Conference on Particle-based Methods – Fundamentals and Applications. Barcelona, 28-29 September 2015. https://spiral.imperial.ac.uk:8443/handle/10044/1/28974